


I. Introduction
The rent to cheonsei ratio, which is applied in case of changing cheonsei (key money) to monthly rent (or changing monthly rent to cheonsei), has continued to decline since the 2000s.
In terms of overall housing (housing general), the nationwide rent to cheonsei ratio showed around 15% in the early 2000s, and dropped up to around 7% in the middle of 2015. And as for the rent to cheonsei ratio in Seoul, it was around 14% in the early 2000s, and dropped to around 6% in the middle of 2015. A decline in the rent to cheonsei ratio means that cheonsei has become relatively expensive compared with monthly rent. On the other hand, it also means that monthly rent has become relatively cheap compared with cheonsei.
The continuous decline of the rent to cheonsei ratio since the 2000s is said to have resulted from financial liberalization and the low interest-rate policy in Korea after the 1997 Asian Financial Crisis. That is, as the financial liberalization allowed households to borrow from financial institutions easily, and the low interest-rate policy led to a continuous decline in the mortgage interest and the credit loan interest, the rent to cheonsei ratio also continued to drop.1) Particularly, the falling rate of the rent to cheonsei ratio seems to be also accelerated according as the low interest-rate structure has been prolonged and financial inclusion of households has been expanded since the 2007 Global Financial Crisis.
The rent to cheonsei ratio, however, sometimes moves differently from market interest rate. For example, from the beginning of 2005 to the middle of 2008, the Korea Treasury Bond yield and the mortgage interest rate showed an uptrend, whereas the rent to cheonsei ratio still dropped or drifted sideways. This implies that while the rent to cheonsei ratio and the market interest rate show co-movement in the long term, there may be a gap between them in the short term.
This paper intends to examine whether the rent to cheonsei ratio and the market interest rate show the long-run equilibrium relationship, and to analyze how a gap between the two variables is adjusted in the short term to find the long-run equilibrium, given the long-run equilibrium relationship between the two variables.
It appears that the process for adjusting a gap between the rent to cheonsei ratio and the market interest and maintaining their long-run equilibrium relationship varies according to the availability of mortgage loan or cheonsei key-money loan from financial market. It appears that the greater the degree of public financial institutions’ financial inclusion of consumers, the more rapid the speed of adjustment.2) Financial inclusion was greater during the 2010s than the 2000s. Therefore, it is supposed that the rent to cheonsei ratio adjusted more rapidly in the 2010s than the 2000s.
Data on the rent to cheonsei ratio currently available can be found largely in the following three: One is data on the rent to cheonsei ratio published by Kookmin Bank (KB) from August 2001 to the beginning of 2011. This data is included in statistical data titled ‘National Housing Price Trend Survey’ published by KB during the period. Another is data called ‘Monthly Rent Interest Rate’ released by the Korea Appraisal Board (KAB) from June 2010 to December 2014. This data is included in statistical data titled ‘Monthly Rent Price Trend Survey’ published by KAB. These two data are based on so-called appraisal information. The other is data on the rent to cheonsei ratio, which are included in ‘National Housing Price Trend Survey’3) announced by KAB. This is data on the rent to cheonsei ratio estimated by using the transaction data of rent and cheonsei. This data was published from 2015, but the time series period of the rent to cheonsei ratio begins with January 2011 from which the transaction data of rent and cheonsei started to be collected.
This paper intends to investigate the long-run equilibrium relationship between the rent to cheonsei ratio and the market interest rate and the process of short-term adjustment to find the long-run equilibrium by time period, using these three data; and to look into whether the long-run and short-run relationships with the market interest rate show differences between the rent to cheonsei ratio based on transaction data and one based on appraisal data.
There are many studies on how the rent to cheonsei ratio is determined. The representative studies include Lee, Chung and Lee (2002), Lee, Chung and Choi (2009), Choi and Ji (2007, 2008), Lee and Chung (2010), Ryu, Ji and Lee (2013), Choi and Lee (2009), Bae (2014), and Kim and Yun (2015). Most of these studies analyzed how the rent to cheonsei ratio is determined in terms of a lessor’s return on investment4). Studies that analyzed how the rent to cheonsei ratio is determined in terms of a lessee’s position are rare. Lee, Choi and Je (2009) analyzed the differences in the rent to cheonsei ratio according to the lessee’s characteristics.
Lim (2009), Sung (2011), and Lee (2012) theoretically analyzed how the rent to cheonsei ratio is determined by the simultaneous equilibrium in the lessor and the lessee.
Studies on the relationship between the rent to cheonsei ratio and the market interest rate are also rare. Lee et al., (2009) investigated the long-run equilibrium relationships between the rent to cheonsei ratio, CD rate and corporate bond yield for a period between September 2002 and December 2007. They found that the rent to cheonsei ratio moved counter to the market interest rate, and also that there was no statistical significance.5)Lee (2012), however, found that the rent to cheonsei ratio had a long-run equilibrium relationship with the mortgage interest rate, using the rent to cheonsei ratio data for a period between August 2001 and March 2011 published by KB. And his analysis showed that disequilibrium is corrected over an extended period.
This study follows up Lee (2012). It, however, is different from the previous study in that it investigates conditions for long-run equilibrium and the short-run adjustment process by time period, using long-term rent to cheonsei ratio data, and that it also examines differences between the rent to cheonsei ratio based on transaction data and that based on appraisal price data.
It is believed that the results of this study will be able to provide a clue to the questions of what risk premium the rent to cheonsei ratio has, compared with the market interest rate, and how much time it will take to resolve disequilibrium caused by a change in the market interest rate. In addition, it is deemed that it will also be possible to confirm whether the rent to cheonsei ratio based on appraisal price data shows smoothing, compared with that based on transaction price data.6)
II. Theoretical Review
The cheonsei system is one of Korea’s unique rental housing systems,7) and is a combined system of money lending and rental housing. It is not easy to understand how the rent to cheonsei ratio is determined, because the lessor and the lessee can have a choice between cheonsei and monthly rent (or monthly rent with security deposit) as well as the cheonsei system is a combined system of money lending and rental housing.
Lee (2012) derived equilibrium conditions for the lessor and for the lessee in choosing between cheonsei and monthly rent, and showed that the cheonsei market and the monthly rent market achieve an equilibrium when the two equilibrium conditions are satisfied simultaneously. And he called the rent to cheonsei ratio at a time when the two markets (cheonsei market and monthly rent market) achieve an equilibrium at the same time ‘the market equilibrium rent to cheonsei ratio,’ and showed theoretically how the rent to cheonsei ratio finds a new equilibrium according as the market interest rate changes.
This paper intends to investigate theoretically how the rent to cheonsei ratio varies with the changes in the market interest rate, on the basis of Lee’s (2012) logic.8) For this, let us first suppose that there are only cheonsei and monthly rent in the rental housing market, and that the lessor and the lessee choose between cheonsei and monthly rent.9) And we suppose that the lessor and the lessee can borrow money at the rate of return on risk-free asset, and deposit money at the same interest rate.10) In addition, it is supposed that the lessor’s equity capital is the same whether the lessor rents a house on a basis of cheonsei or monthly rent. It is assumed that the lessee’s equity capital is also the same whether the lessee leases a house on a basis of cheonsei or monthly rent.
It is assumed that the lessor purchases and rents a house priced at , raising money for it by borrowing , which is equivalent to cheonsei key money, and providing () from the lessor’s own capital. It is assumed that in case of renting this house on a cheonsei basis, is raised by cheonsei key money, while in case of renting it on a monthly rent basis, is borrowed from a financial institution. And it is assumed that in case of leasing a house on a cheonsei basis, the lessee borrows from a financial institution, while in case of leasing it on a monthly rent basis, he does not borrow money.
In the case of the lessor, the choice between renting on a cheonsei basis and renting on a monthly rent basis becomes indifferent only when the return on equity is the same whether he rents a house on a basis of cheonsei or monthly rent11). The return on equity for a case of renting a house on a cheonsei basis () can be expressed as Eq. (1), and that for a case of renting it on a monthly rent basis () can be expressed as Eq. (2). And the lessor’s equilibrium conditions are as shown in Eq. (3).
Where denotes the expected capital gain, and denotes rent that can be received in case of renting a house on a monthly rent basis. is the expected rate of loss due to vacancy or bad tenant in case of renting a house on a monthly rent basis. And denotes the return on risk-free asset, and it is the same as the interest rate for loan according to assumption.
Eq. (3) can be arranged as Eq.(4).
where
In Eq. (4), is the rent to cheonsei ratio,12) and denotes the premium for rental risk (the risk of vacancy, or the arrearage or non-payment of rent) that the lessor should take when he chooses monthly rent. Eq. (4) means that the lessor becomes indifferent between cheonsei and monthly rent only when the rent to cheonsei ratio is the same with the return on risk-free asset plus a premium for rental risk.
If (if ), the lessor will choose monthly rent instead of cheonsei. On the contrary, if (if ), the lessor will choose cheonsei instead of monthly rent.
On the other hand, the lessee’s choice between cheonsei and monthly rent becomes indifferent only when housing cost is the same whether leasing on a cheonsei basis or on a monthly rent basis. The lessee’s housing cost in case of leasing on a cheonsei basis () is equivalent to Eq. (5). And that in case of leasing on a monthly rent () is equivalent to Eq. (6). The lessee’s equilibrium conditions are as shown in Eq. (7).
H is a sort of contingent cost that the lessee may incur by choosing cheonsei. It includes cost caused by the lessor’s bankruptcy and by failing to get back cheonsei key money timely.
Eq. (7) can be arranged as Eq. (8) below.
where
In Eq. (8), denotes the lessee’s premium for risk of choosing cheonsei. Eq. (8) means that the lessee becomes indifferent between cheonsei and monthly rent only when the rent to cheonsei ratio is the same with the return on risk-free asset plus a risk premium on private lending (lending the cheonsei key money to the lessor).
If (if ), the lessee will choose cheonsei instead of monthly rent. On the contrary, if (if ), the lessee will choose monthly rent instead of cheonsei.
If the lessor and the lessee are in equilibrium at the same time, the cheonsei market and the monthly rent market are also in equilibrium. That is, if Eq. (9) is valid, the cheonsei market and the monthly rent market achieve an equilibrium at the same time.
Eq. (9) indicates that the cheonsei market and the monthly rent market are in equilibrium at the same time only when the lessor’s risk premium coincides with the lessee’s risk premium. Is this possible? There exists an equilibrium point at which Eq. (9) is satisfied because lessors and lessees have different risk premiums according to their own demographic and economic characteristics. For example, if a lessee has a lending risk premium lower than the equilibrium risk premium (), he/she will choose cheonsei. On the contrary, if a lessee has a lending risk premium higher than the equilibrium risk premium, he/she will choose monthly rent. Similarly, if a lessor has a renting risk premium lower than the equilibrium risk premium, he/she will choose monthly rent. On the contrary, if a lessor has a renting risk premium higher than the equilibrium risk premium, he/she will choose cheonsei.
For the simplification of the theoretical model, we assumed above that both lessor and lessee can borrow money at the rate of return on risk-free asset. However, borrowing interest rates for the lessor and the lessee may be different. Generally, the lessor’s loan interest rate is low because a house is used as a guarantee, whereas the lessee’s loan interest is high because of having to borrow money on credit. This, however, also varies according to the lessor’s and the lessee’s demographic and economic characteristics. If even a lessor is heavily in debt, the financing cost will be high. If a lessee has good credit, the financing cost will be low. When the credit spread on the lessor’s financing is denoted by and the credit spread on the lessee’s financing is denoted by , Eq. (9) is modified as follows:
To think about the credit spread alone, among lessors, a lessor who have difficulty in financing will require a rent to cheonsei ratio higher than the equilibrium rent to cheonsei ratio in the market because he/she should pay a high premium. In this case, this lessor will choose cheonsei because of . As for a lessor who can finance money easily, he/she will choose monthly rent on the contrary for due to a low credit spread.
In addition, among lessees, a lessee who can finance money easily (in particular, one who has his own money or can get cheonsei key money from parents) will require a rent to cheonsei ratio lower than the equilibrium rent to cheonsei ratio in the market. Thus, this lessee will choose cheonsei for . As for a lessee who has difficulty in financing money will choose monthly rent on the contrary because of due to a high credit spread.
If the market interest rate drops (if , the rate of return on risk-free asset, drops to ) under the condition of the simultaneous equilibrium of the cheonsei market and the monthly rent market, some of lessors who chose cheonsei will choose monthly rent because of (a decrease in the supply of cheonsei, an increase in the supply of monthly rent). Also, some of lessees who chose monthly rent will choose cheonsei because of (an increase in demand for cheonsei, a decrease in demand for monthly rent). As a result, the rent to cheonsei ratio comes to fall as the cheonsei price rises and the monthly rent price falls. Through this process, the cheonsei market and the monthly rent market come to find a new equilibrium.
As shown above, a change in the market interest rate changes the rent to cheonsei ratio through demand and supply changes in the cheonsei market and the monthly rent market. These changes, however, may not occur immediately in the real world. For example, even though the market interest rate changes, the supply and demand changes in the cheonsei market and the monthly rent market may happen slowly due to the remaining period of a rental contract, costs of house moving, time taken to borrow money, etc. As a result, changes in the cheonsei price and the monthly rent price and the change of the rent to cheonsei ratio may occur with time lags. That is, while the rent to cheonsei ratio finds a new equilibrium according to changes in the market interest rate in the long term, it may be said that equilibrium error caused by the change of the market interest rate is slowly adjusted in the short term.
Let us model this process in which the rent to cheonsei ratio finds an equilibrium in the short and long term.13) As shown above, the condition for the simultaneous equilibrium of the cheonsei market and the monthly rent market is , where the risk premium, (), is not observable. And the Korea Treasury Bond yield, which represents the market interest, is usually used as the rate of return on risk-free asset. However, the Korea Treasury Bond yield is not exactly equal to the theoretical rate of returns on risk-free asset because the yields of the bonds vary in liquidity risk according to their maturities. Accordingly, the long-run equilibrium relationship between the rent to cheonsei ratio and the market interest rate can be estimated with the following equation.
Where denotes the rent to cheonsei ratio, and denotes the market interest rate that acts as proxy for the rate of return on risk-free asset. It may be said that estimated by Eq. (11) is the equilibrium rent to cheonsei ratio that achieves the simultaneous equilibrium of the cheonsei market and the monthly rent market.
If the rent to cheonsei ratio and the market interest rate are non-stationary time series, Eq. (11) becomes the so-called cointegration function. In this case, an error correction model (ECM) in the form of difference shows the process in which the rent to cheonsei ratio adjusts equilibrium error in the short term. The error correction model in the form of difference is as shown in Eq. (12).
Where denotes the degree of disequilibrium of the rent to cheonsei ratio in the previous period. Eq. (12) means that when the market interest rate changes, the rent to cheonsei ratio reflects some of the change, and corrects some of disequilibrium in the previous period at the same time. The rent to cheonsei ratio converges to equilibrium only when the sign of is ‘negative (-).’ That is, if the rent to cheonsei ratio is higher than the equilibrium level, the rent to cheonsei ratio should drop in the following period to converge to the equilibrium. In the opposite case, the rent to cheonsei ratio should rise in the following period.14)
III. Empirical Analysis
For the estimation of Eq. (11) and Eq. (12), this study uses three types of rent to cheonsei ratio data mentioned in the Introduction (Data on the rent to cheonsei ratio published by KB; data on monthly rent interest rate in the Monthly Rent Price Trend Survey published by KAB; and data on the rent to cheonsei ratio in the National Housing Price Trend Survey announced by KAB).
The three rent to cheonsei ratios to be used in empirical analysis vary in time periods and data sources, and show differences in regions covered and house types. And there are also differences in the sources of price data (data on cheonsei and monthly rent), which serve as the grounds for the calculation of the rent to cheonsei ratio.
As for the data on the rent to cheonsei ratio published by KB, its time series began from August 2001, but was not published after March 2011. This data was based on licensed real estate agents’ appraisal price, and was subdivided by region into the whole nation, the Seoul metropolitan area, provinces, metropolitan cities, and Seoul. But it was not subdivided by houses type.
As for the data on monthly rent interest rate published by KAB, it was based on appraisal price like KB’s data, and its time series began from August 2010. This data was published until December 2014 only. This data is limited to the Seoul metropolitan area, Seoul, and metropolitan cities, and was not subdivided by house type.
On the other hand, the data on the rent to cheonsei ratio announced by KAB has been estimated on the basis of transaction data, and differs in characteristics from the above two data on the rent to cheonsei ratio. This data has been published since January 2011, and includes the whole nation, the Seoul metropolitan area, eight Dos (provinces), and metropolitan cities by region. It also subdivides house types into all houses, apartment, detached house, and row house.
The investigation of the long-run relationship between the rent to cheonsei ratio and the market interest rate requires a long period time-series, if possible. In this regard, the KB data on rent to cheonsei ratio has no problem in investigating the long-run relationship with the market interest ratio because it has a time series as long as 10 years. It, however, has the disadvantage that it can’t show the recent relationship. On the other hand, the KAB data on monthly rent interest rate or the rent to cheonsei ratio can show recent relationship, but has difficulty in showing the long-run relationship sufficiently for they have short time periods.
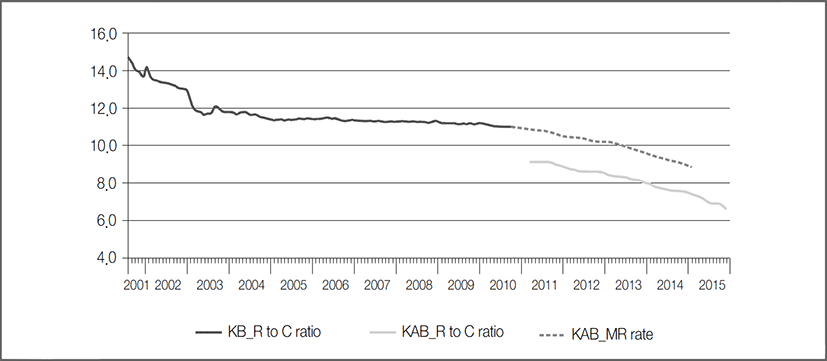
Given the above, this paper intends to generate a long-term time series data of the rent to cheonsei ratio by combining the KB data and the KAB data, and to investigate the long-run relationship between the rent to cheonsei ratio and the market interest rate. The KAB’s rent to cheonsei ratio shows the average difference of about 2%p in the KAB’s monthly rent interest rate and the KB’s rent to cheonsei ratio. On the other hand, it seems that there is almost no difference between the KB’s rent to cheonsei ratio data and the KAB’s monthly rent interest rate data, which are based on appraisal price.15)
Thus, we decided to combine the KB’s rent to cheonsei ratio and the KAB’s monthly rent interest rate into one time series,16) to estimate the long-run equilibrium relationship between this time series and the market interest rate, and to analyze the process of short-term adjustment. ‘But the common regions of the two time series are limited to the Seoul metropolitan area and Seoul. So we decided to make analysis using the data of rent to cheonsei ratio on the basis of all houses in the Seoul metropolitan area because ‘all houses’ is the only house type available from the data.17)
For the market interest rate, which represents the return on risk-free asset, data on Korea Treasury Bond yields was used, provided that the three-year bond yield was used given that the term of a cheonsei agreement is about three years on average.
If the degree of financial inclusion changes, the adjustment process of rent to cheonsei ratio may change. As for the volume of cheonsei key money loan guarantee by the Housing Finance Credit Guarantee Fund, the rate of an increase in the guarantee of cheonsei key money loan was very slow until 2006. Then, the rate of an increase in the guarantee becomes very fast after 2007. Given that the cheonsei key money loan is a kind of credit loan, the increase in cheonsei key money loan by the credit guarantee by the government may be interpreted as the expansion of financial inclusion of households.
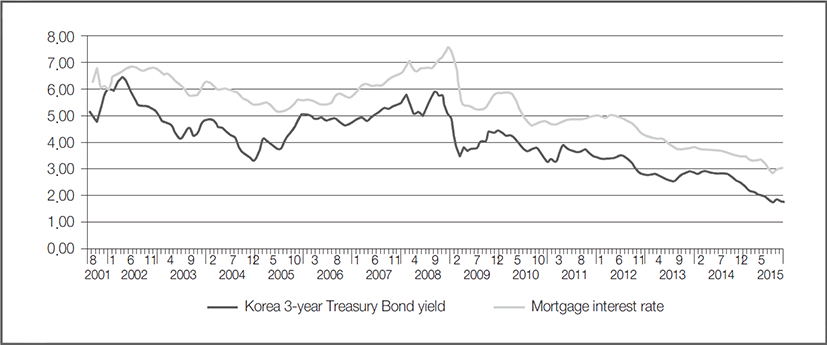
On the other hand, as for the trends of the Korea 3-year Treasury Bond yield and the mortgage interest rate, although they show a downward trend in the long term, they showed a downward trend and an upward trend alternately before the mid to late 2008. Then, they have showed a continuous downward trend since 2009. There may be differences in the long-run equilibrium and the short-term adjustment process of the rent to cheonsei ratio between when the market interest rate repeats fluctuations and when it continues to fall.
Consequently, we will investigate whether there are differences in the long-run equilibrium and the short-term adjustment process of the rent to cheonsei ratio by dividing the analysis period into before and after 2008. And with the KAB’s data on the rent to cheonsei ratio and the monthly rent interest rate, we will investigate whether there are differences in the long-run equilibrium relationship or the process of short-term adjustment between the rent to cheonsei ratio based on appraisal price and that based on transaction price.
Before investigating the long-run equilibrium relationship between the rent to cheonsei ratio and the Korea 3-year Treasury Bond yield, we tested whether there are any unit roots in the two time series, using ADF test, DF-GLS test, and KPSS test (Kwiatkowsk -Phillips-Schmidt-Shin test). The results of the tests showed that there are the unit roots both in the rent to cheonsei ratio and the Korea 3-year Treasury Bond yield.18)
As the two variables have the unit roots, we tested whether the two variables have a long-run equilibrium relationship by using the cointegration test. As a result of testing a cointegration relationship between the two variables, using the Johansen’s cointegration test,19) the null hypothesis of ‘There is no cointegration.’ was rejected. Therefore, it was judged that there is a cointegration relationship between the rent to cheonsei ratio and the Korea 3-year Treasury Bond yield.
As it was found that the rent to cheonsei ratio and the Korea 3-year Treasury Bond yield have the unit root, respectively, and that there is the cointegration relationship between the two variables, Eq. (11), which shows the long-run equilibrium relationship between the two variables, was estimated. As a result of estimating Eq. (11), using the time series data ranging from August 2001 to December 2014, it was found that the rent to cheonsei ratio fluctuated in the long term, reflecting about 89% of the variation of the Korea 3-year Treasury Bond yield. The size of the constant term, which shows the risk premium size of cheonsei indirectly, was about 7.6% point.
And after dividing the time series data into before and after 2008,20) we estimated Eq. (11). Differences in estimates between the two periods were revealed clearly. As a result of investigating the long-run equilibrium relationship between the rent to cheonsei ratio and the Korea 3-year Treasury Bond yield after setting the period from August 2001 to December 2008 as one period, it was found that the rent to cheonsei ratio fluctuated, with reflecting only about 55% of the variation in the Korea 3-year Treasury Bond yield. And the size of the constant term, which shows risk premium, was about 9.3% points. However, in case of setting the period from January 2009 to December 2014 as one period, it was found that the rent to cheonsei ratio during this period fluctuated about 1.1 times more than the variation of the Korea 3-year Treasury Bond yield, and that the size of the constant term, which shows the risk premium, was about 6.8% points.
As a result of the Wald test on the null hypothesis that the estimation coefficient of the Korea 3-year Treasury Bond yield is 1, the estimation coefficient of the Korea 3-year Treasury Bond yield with the time series from January 2009 to December 2014 failed to reject the null hypothesis. However, the estimation coefficient of the Korea 3-year Treasury Bond yield estimated with the time series from August 2001 to December 2008 rejected the null hypothesis that its value is 1.21) On the other hand, the standard error of regressor estimated with data from January 2009 to December 2014 was lower than 1/2 of that estimated with the data from January 2001 to December 2008.
These results of estimation can be understood clearly when examining the trends of variation in the rent to cheonsei ratio and the Korea 3-year Treasury Bond yield after 2001. From 2001 to the end of 2008, the Korea 3-year Treasury Bond yield showed a downward trend with small fluctuations. On the other hand, the rent to cheonsei ratio showed a continuous downward trend during the same period. After 2009, however, both of the Korea 3-year Treasury Bond yield and the rent to cheonsei ratio showed a continuous downward trend without great fluctuation.
Looking to these movements of the two variables, from 2001 to the end of 2008, it seems to be inevitable that the rent to cheonsei ratio responded insensitively to the changes of the Korea 3-year Treasury Bond yield, and that the standard error of regressor was also great. On the other hand, after 2009, the rent to cheonsei ratio followed the changes of the Korea 3-year Treasury Bond yield exactly. And consequently, it is found that the standard error of regressor was very small.
The results mentioned above means that the estimation coefficient value can vary with time. Actually, the risk premium of the rent to cheonsei ratio may vary with time, and thus the estimation coefficient of the constant term, which shows the risk premium as proxy for it, may vary over time.
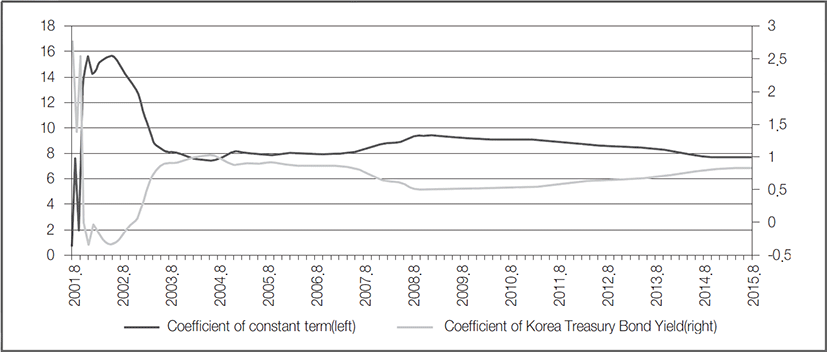
Given that the estimation coefficient value may vary with time, this paper estimated Eq. (11) with the state space model, which is used to identify unobserved components. The model was estimated with Kalman filtering, under the assumption of the random walk of the coefficient of the constant term in Eq. (11). Specifically, the state space model of Eq. (11) is as shown in Eq. (13).
The results of the estimation of Eq. (13) are as shown in Table 5. And the trends of estimation coefficients for the constant term and the Korea 3-year Treasury Bond yield over time are as shown in Fig. 4. As seen in the figure, the estimation coefficient of the constant term shows the trend of continuously rising after 2003 and falling after 2008. And on the contrary, the estimation coefficient of the Korea 3-year Treasury Bond yield shows the trend of continuously falling after 2003 and rising after 2008.
| Final State | Root MSE | z-Statistic | Prob. | |
|---|---|---|---|---|
| Constant term | 7.641 | 3.34E-09 | 2.29E+09 | 0.000 |
| Korea 3-year Treasury Bond yield | 0.860 | 7.78E-10 | 1.10E+09 | 0.000 |
On the other hand, in order to find out what differences the rent to cheonsei ratio based on transaction price data and that based on appraisal price data show in the long-run relationship with the Korea 3-year Treasury Bond yield, we estimated Eq. (11) with the KAB’s rent to cheonsei ratio data (transaction price data) and KAB’s monthly rent interest rate data (appraisal price data). The common period of the two data is from January 2011 to December 2014, which is not sufficient to estimate the long-run equilibrium relationship. However, we expected that only the nature of transaction price data and appraisal price data could be identified from the estimation results of the two data.
The results of estimating the long-run equilibrium relationship with the Korea 3-year Treasury Bond yield by using KAB’s monthly rent interest rate data based on appraisal price data showed no great difference from results of the above estimation using the data on the period from January 2009 to December 2014. However, the results of estimating the long-run equilibrium relationship with the Korea 3-year Treasury Bond yield by using KAB’s rent to cheonsei ratio data based on transaction price data were found to be somewhat different. There was no great difference in the estimation coefficient of the Korea 3-year Treasury Bond yield, while the size of the constant term, which shows the size of risk premium, was lower by about 1.4% points from 6.6% points to 5.2% points.
In general, the appraisal price is known to have lower volatility than transaction price, and to follow the changes of transaction price. Owing to these characteristics of appraisal price, it was expected that the rent to cheonsei ratio based on appraisal price data reflected the changes of the Korea 3-year Treasury Bond yield less than the rent to cheonsei ratio based on transaction price data. Actually, however, there was no difference. The two were different only in the risk premium; the risk premium of the rent to cheonsei ratio based on appraisal price data was found to be somewhat higher.
Given that the rent to cheonsei ratio has a long-run equilibrium relationship with the Korea 3-year Treasury Bond yield, if the rent to cheonsei ratio breaks away from the long-run equilibrium relationship, it should be corrected to converge to the equilibrium relationship. We estimated Eq. (12) to find out whether the rent to cheonsei ratio actually converges to the equilibrium relationship by adjusting disequilibrium.
The adjustment process of the rent to cheonsei ratio was estimated, using the time series data extending from August 2001 to December 2014. As a result of the estimation, it was found that the rent to cheonsei ratio converges to the long-run equilibrium by reducing the estimation error of the previous period about 5.9% every month.
The results of estimation using time series data on the period between August 2001 and December 2008 were also similar. It was found that the rent to cheonsei ratio converged to the long-run equilibrium by correcting the error of the previous period about 7.9% every month.
However, the results of estimation using time series data on the period from January 2009 to December 2014 were quite different. It was found that the rent to cheonsei ratio did not correct the error of the previous period. This may be either because the rent to cheonsei ratio was on the downward trend after 2009 or because there was no error to correct as the rent to cheonsei ratio moved very closely with the Korea 3-year Treasury Bond yield after around 2009.22)
On the other hand, the adjustment equation of Eq. (12) was estimated similarly, using KAB’s rent to cheonsei ratio data based on transaction price data and KAB’s monthly rent interest rate based on appraisal price data on the period from January 2011 to December 2014.
The results of the estimation in Table 8 showed no great difference from the estimation results of the adjustment equation estimated by the time series data for the period from January 2009 to December 2014 in Table 7. That is, it was found that the error of the previous period has no great effect on the current rent to cheonsei ratio.
IV. Conclusion
It is known that a decline in the market interest rate is behind the continuous fall in the rent to cheonsei ratio since the 2000s. This paper estimated the long-run equilibrium relationship and the short-term adjustment process between the rent to cheonsei ratio and the Korea 3-year Treasury Bond yield. For this, a time series data of the rent to cheonsei ratio was generated by combining the KB’s rent to cheonsei ratio data (August 2001 - March 2011) and KAB’s monthly rent interest rate data (August 2010 - December 2014), which were prepared on the basis of appraisal price data. What is common to the rent to cheonsei ratio data of the two institutions is data on all houses in the Seoul metropolitan area, and thus the target region and house type of analysis were restricted to the Seoul metropolitan area and all houses.
The results of analysis revealed that the rent to cheonsei ratio has a long-run equilibrium relationship with the Korea 3-year Treasury Bond yield. It was found that in the long term, if the Korea 3-year Treasury Bond yield fluctuates 1% point, the rent to cheonsei ratio fluctuates 0.89% point. And we found that the risk premium implied in the rent to cheonsei ratio is about 7.56% points. And it was found that if the rent to cheonsei ratio breaks away from the long- run equilibrium relationship with the Korea 3-year Treasury Bond yield, it converges to the long-run equilibrium by adjusting about 5.9% of disequilibrium every month.
The market interest rate continued to drop in the 2000s. However, it was from 2008 that such a downtrend became more conspicuous. And the cheonsei key money loan was also greatly expanded around that time. Therefore, this paper attempted to analyze the relationship between the rent to cheonsei ratio and the Korea 3-year Treasury Bond yield by dividing the data into before and after 2008. As a result of the analysis, it was found that before 2008, the rent to cheonsei ratio responded insensitively to the variation of the Korea 3-year Treasury Bond yield, and that the risk premium was rather high 9.29% points. And it was found that if the rent to cheonsei ratio broke away from the equilibrium in the short term, it made adjustment to converge to the equilibrium.
After 2008, however, it was found that the rent to cheonsei ratio moved almost in parallel with the Korea 3-year Treasury Bond yield, and that the risk premium was 6.77% points, and considerably low, compared with the period before 2008. And the rent to cheonsei ratio showed no great breakaway from the long-run equilibrium, and showed a consistent downtrend. Thus it was found that there was no correction of breakaway from the long-run equilibrium.
In this regard, it may be said that around 2008, there were structural changes in the long-run equilibrium relationship between the rent to cheonsei ratio and the Korea 3-year Treasury Bond yield. However, it is too early to judge that such changes were really structural changes or a temporary phenomenon, because the period of time series after 2008 was too short. Also it is yet difficult to judge whether there were structural changes, because there has been no change in the market interest rate from the downtrend to an uptrend since 2008.
That the rent to cheonsei ratio has recently moved together with the market interest rate means that the cheonsei market and the monthly rent market respond rapidly to the change of the market interest rate. It is not yet known whether they would show such response when the market interest rate rises in the future. In case that the market interest rate rises, if the rent to cheonsei ratio reflects it as it is, the cheonsei price would show a downturn at once.
The decline in the rent to cheonsei ratio combined with the drop in the market interest rate implies that even the government’s intervention in the rental market will have limited effects. That is, despite the intervention in the market to suppress a rise in cheonsei price, the upward pressure on price still exists until the rent to cheonsei ratio finds equilibrium.
On the other hand, the same analysis was carried out to find out what differences there are between the rent to cheonsei ratio based on transaction price data and that based on appraisal price data, using KAB’s rent to cheonsei ratio data (the rent to cheonsei ratio data based on transaction price data) and KAB’s monthly rent interest rate data (the rent to cheonsei ratio data based on appraisal price data) for a period between January 2011 and December 2014. As a result of the analysis, it was found that the two data had the difference in risk premium only, but had no difference in the long-run and short-run relationships with the Korea 3-year Treasury Bond yield. The rent to cheonsei ratio based on transaction price data showed the risk premium of 5.21% points, which is lower than 6.58% points for the rent to cheonsei ratio based on appraisal price data. This means that the rent to cheonsei ratio based on appraisal price data has no difference from that based on transaction price data, except that the former evaluates the risk premium rather excessively.